The following is data queried using sql stored procedures and visualizations presented in Tableau:
CREATE PROCEDURE topNamePerStateByYear -- stored procedure to find popular name by year and gender
@gender_input NVARCHAR(50),
@year_input INT
AS
WITH myrowset
AS(
SELECT
    state_name,
    gender_name,
    year_name,
    name_name,
    count_name,
    row_number() OVER(Partition by state_name ORDER BY count_name DESC) AS rownumber,
    dense_rank() OVER(ORDER BY count_name DESC) AS ranking
FROM
    name_table
WHERE
    gender_name = @gender_input and year_name = @year_input
GROUP BY
    state_name, gender_name, year_name, name_name, count_name)
SELECT * FROM myrowset WHERE rownumber <= 1 ORDER BY state_name ASC, count_name DESC;

EXEC topNamePerStateByYear @gender_input = 'm', @year_input = 2014;
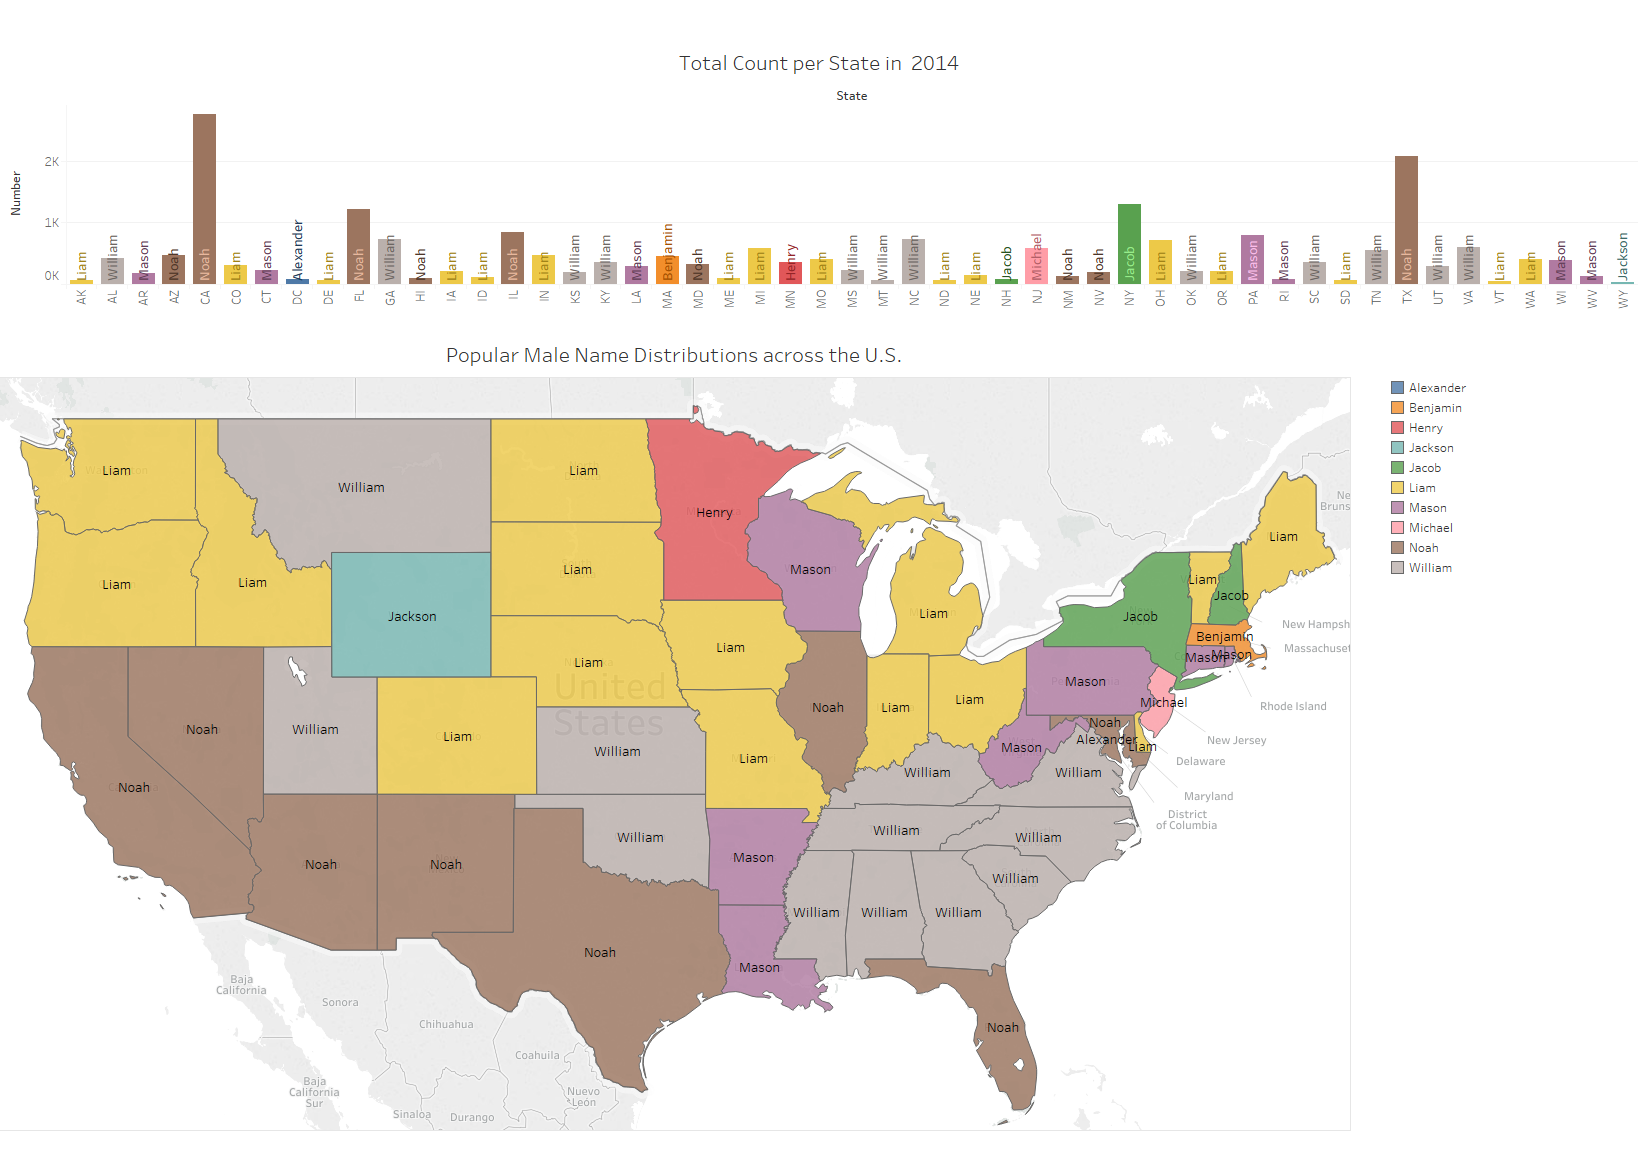
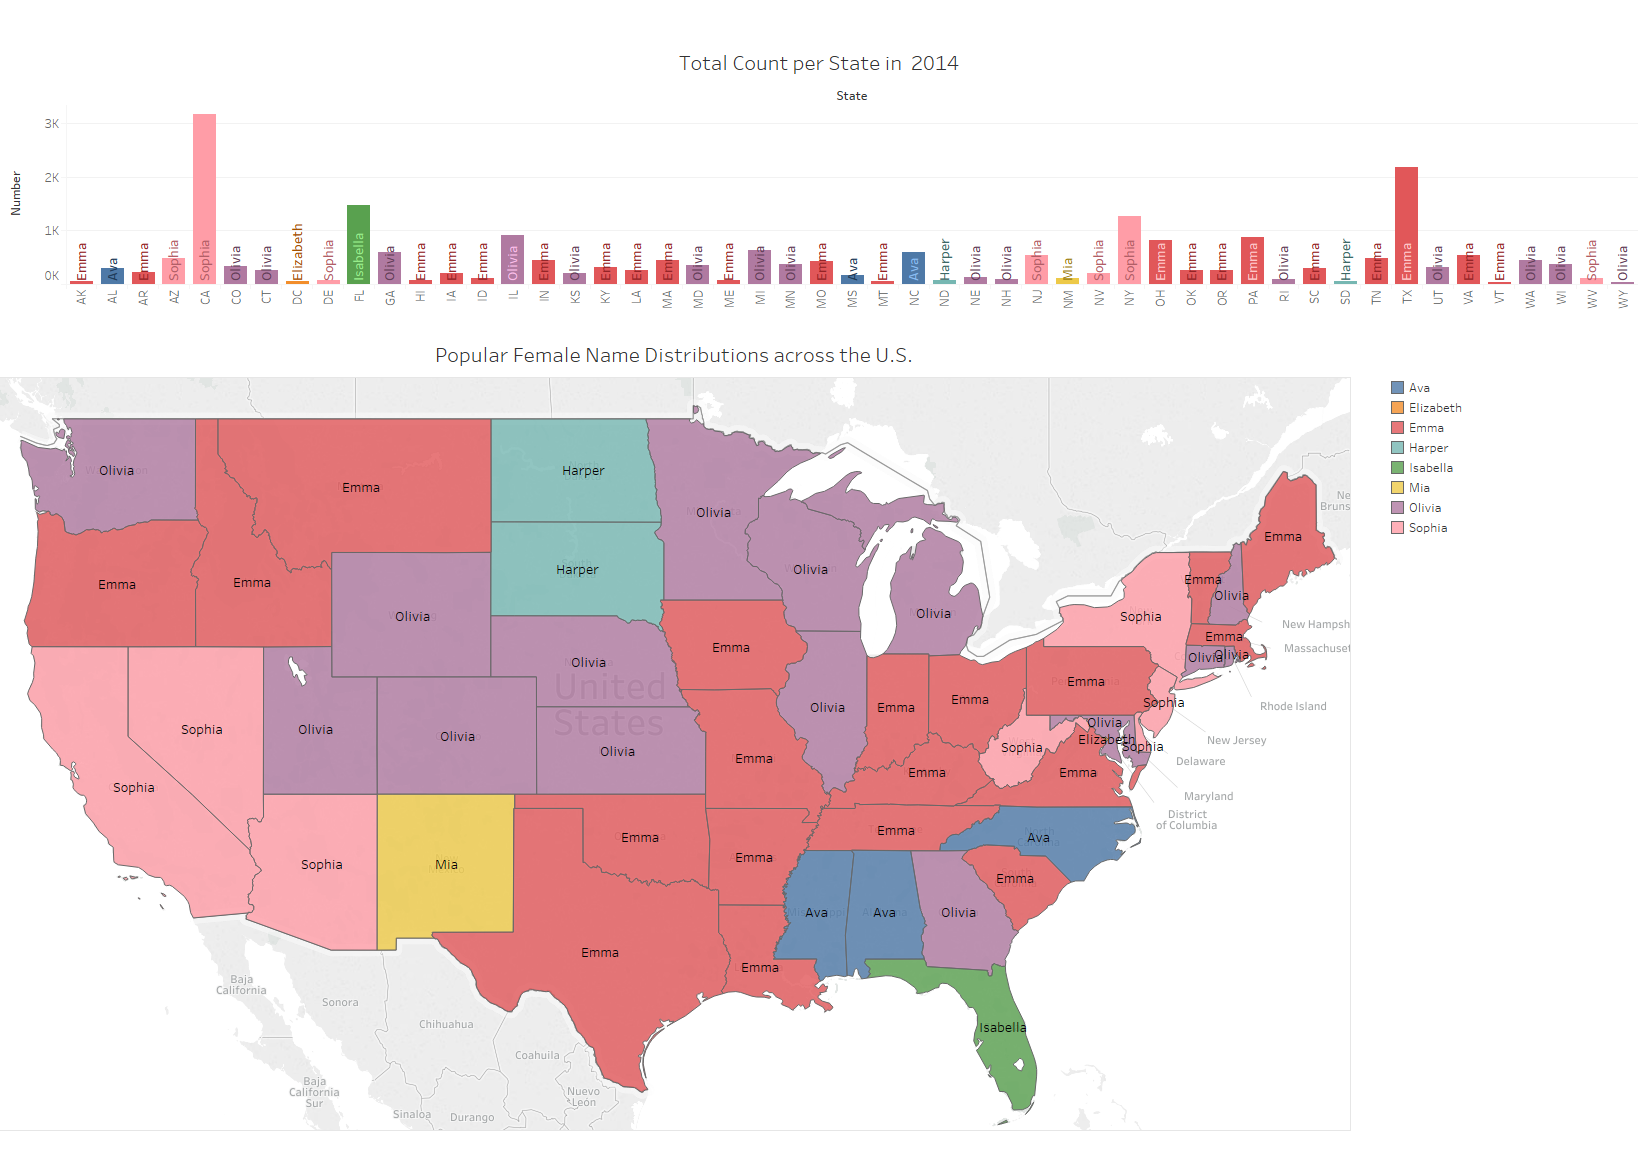
1) Comparing male and female names in 2014:
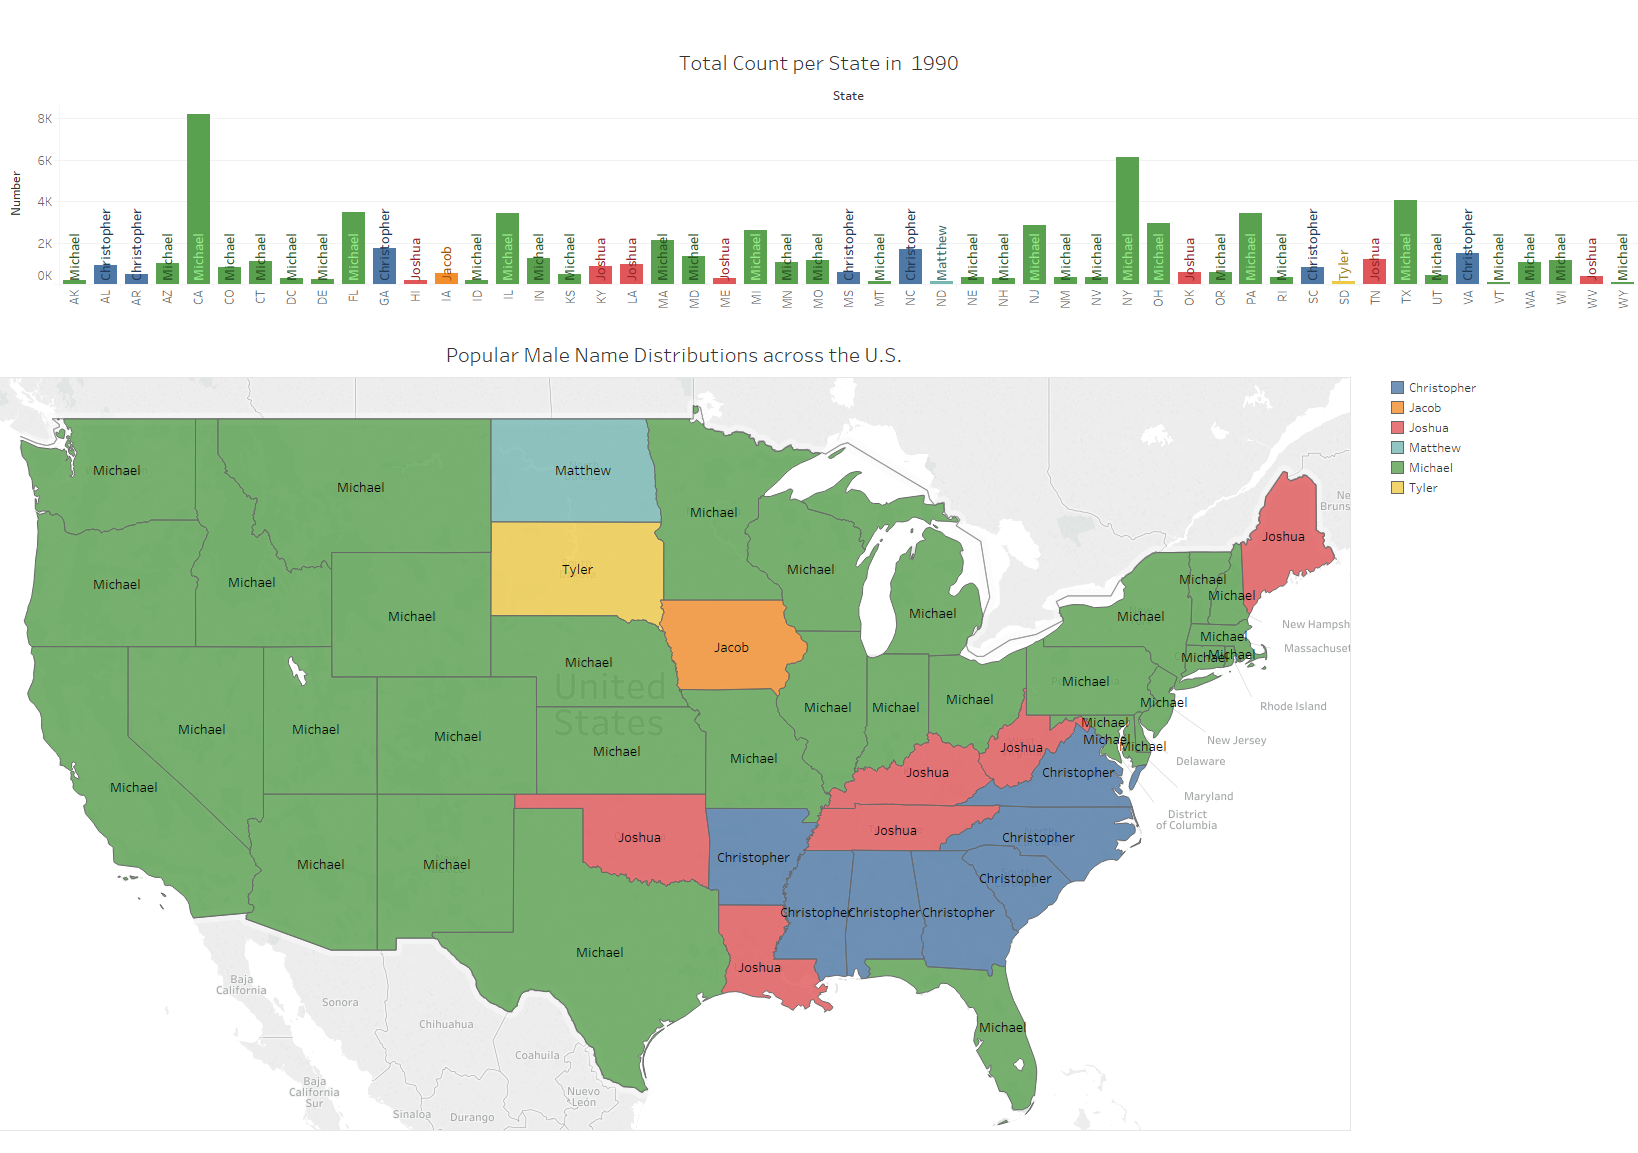
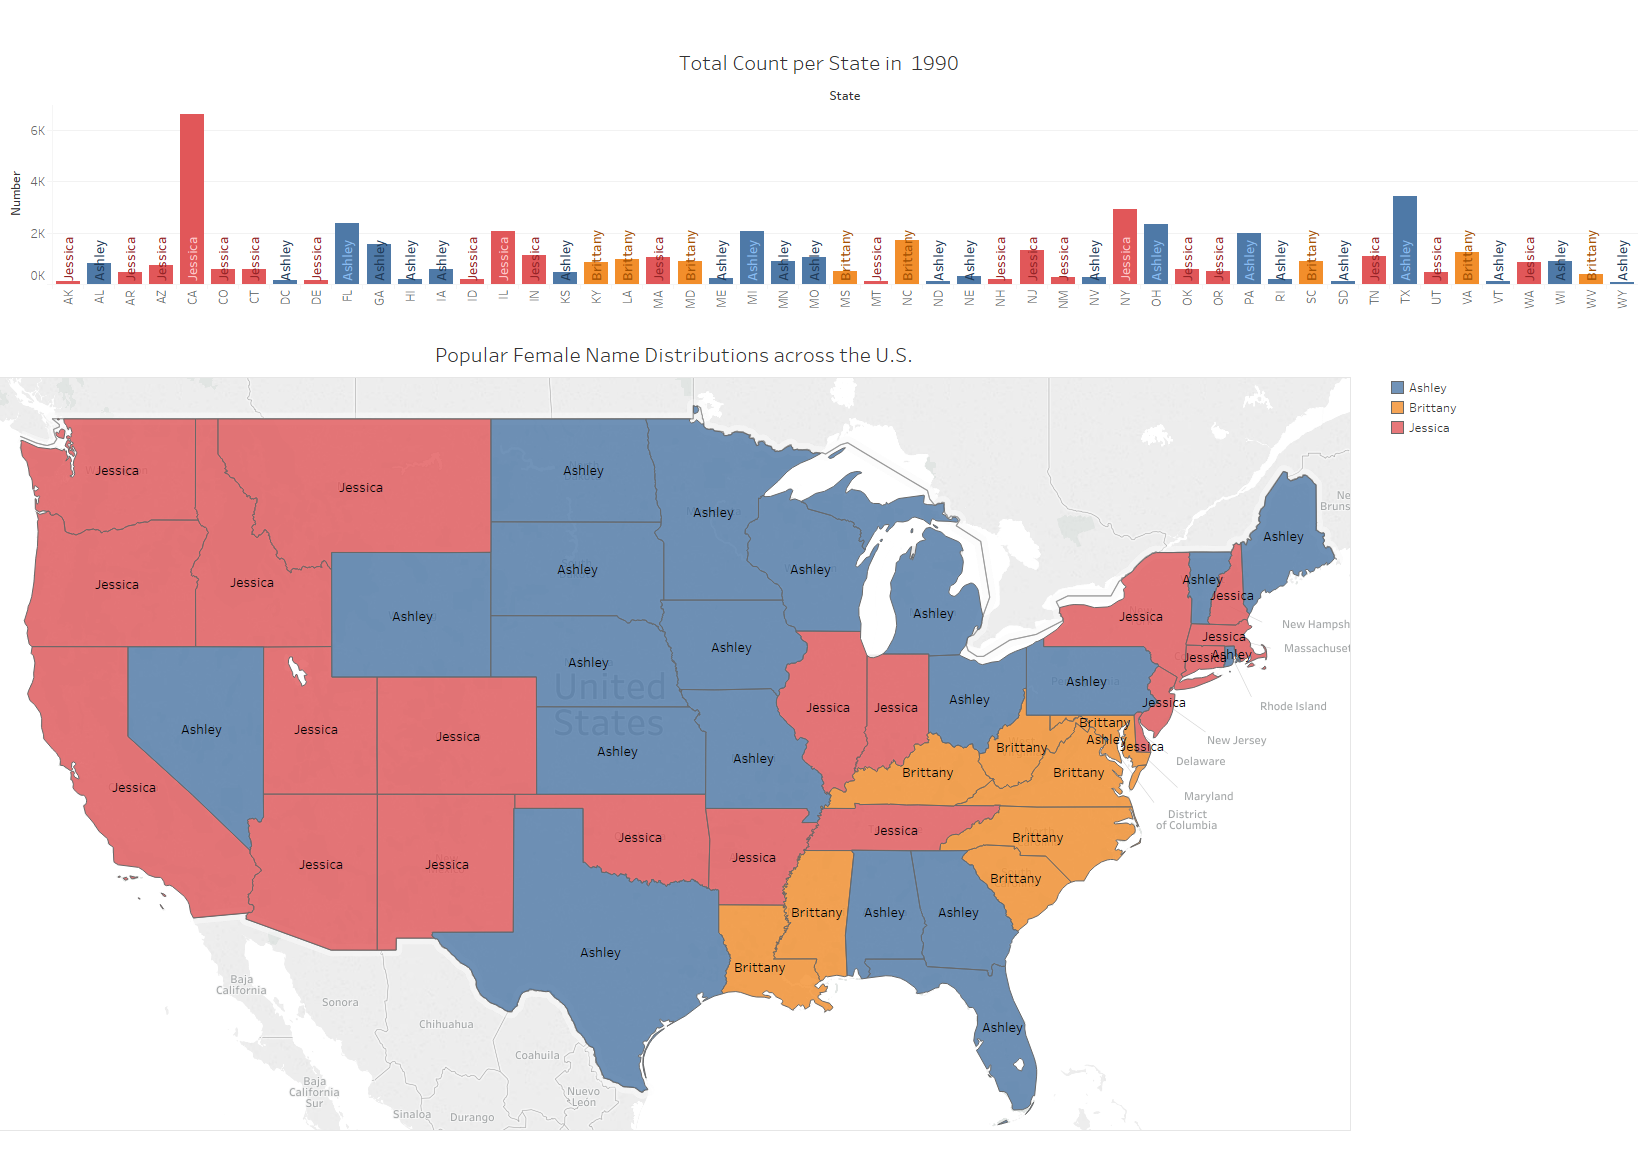
2) Comparing male and female names in 1990:
3) Comparing male and female names in 1980:
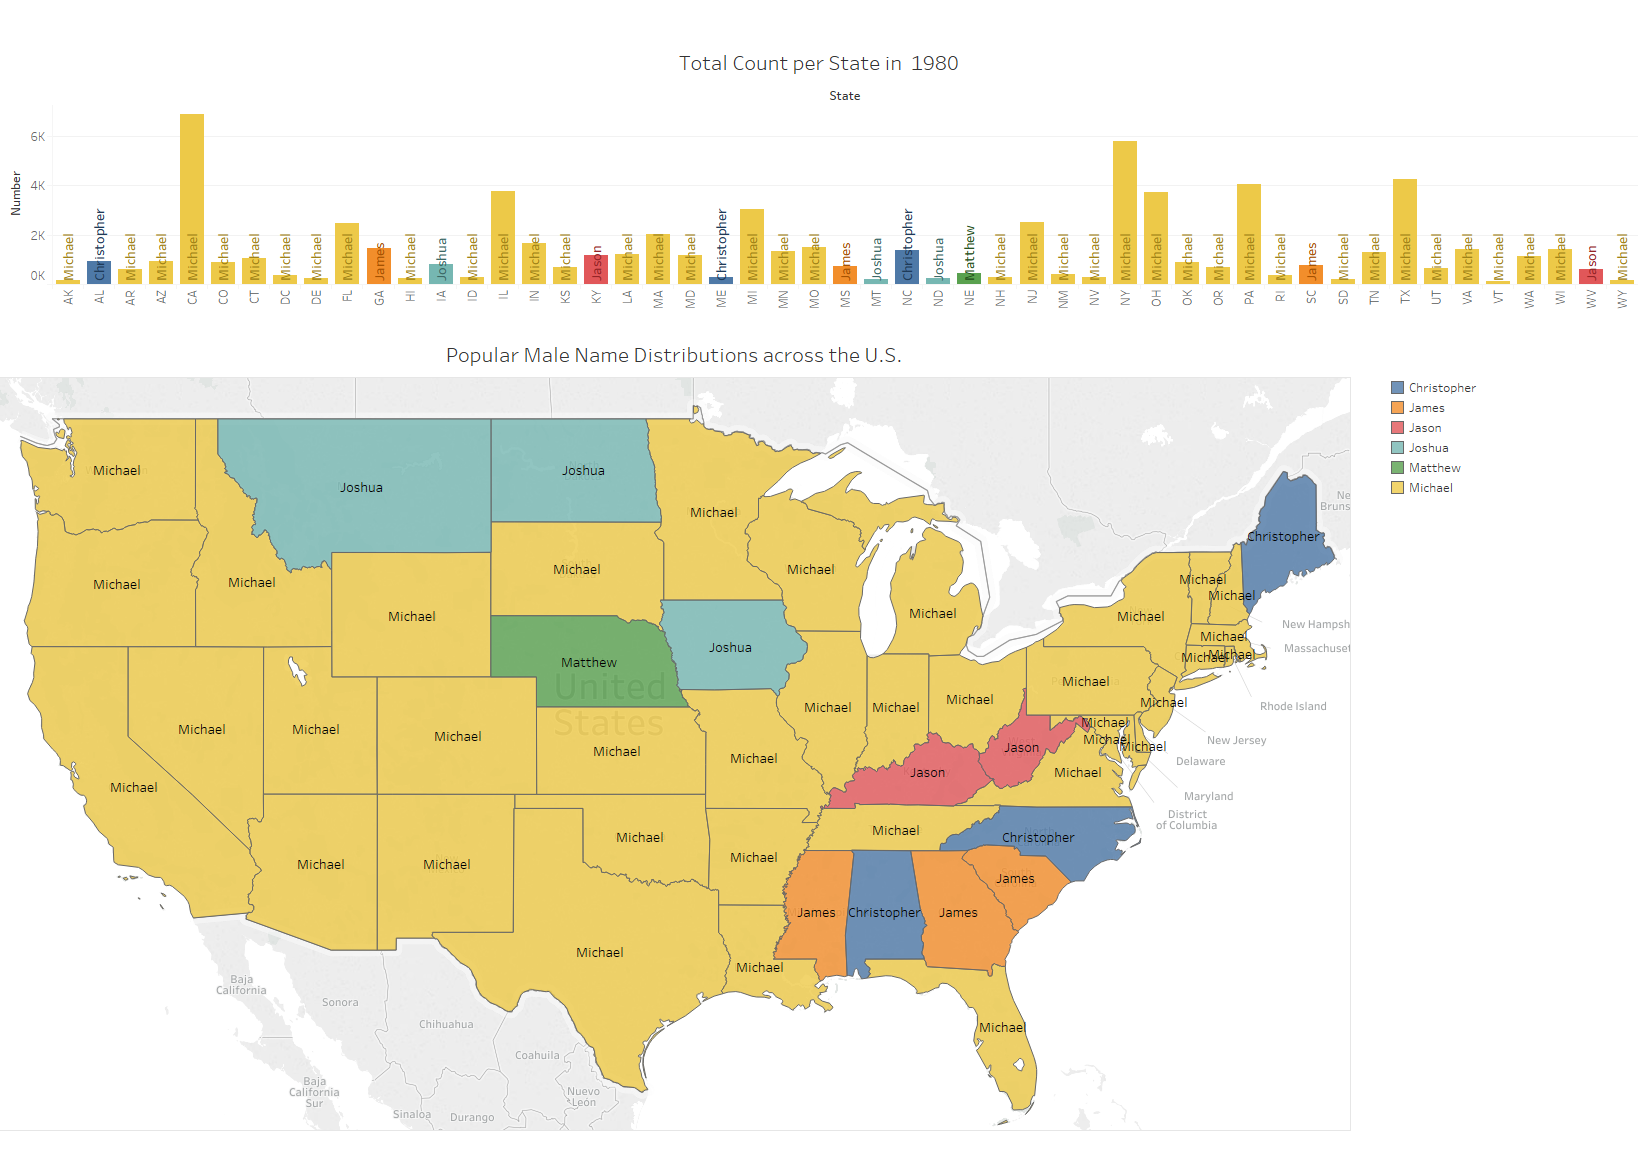
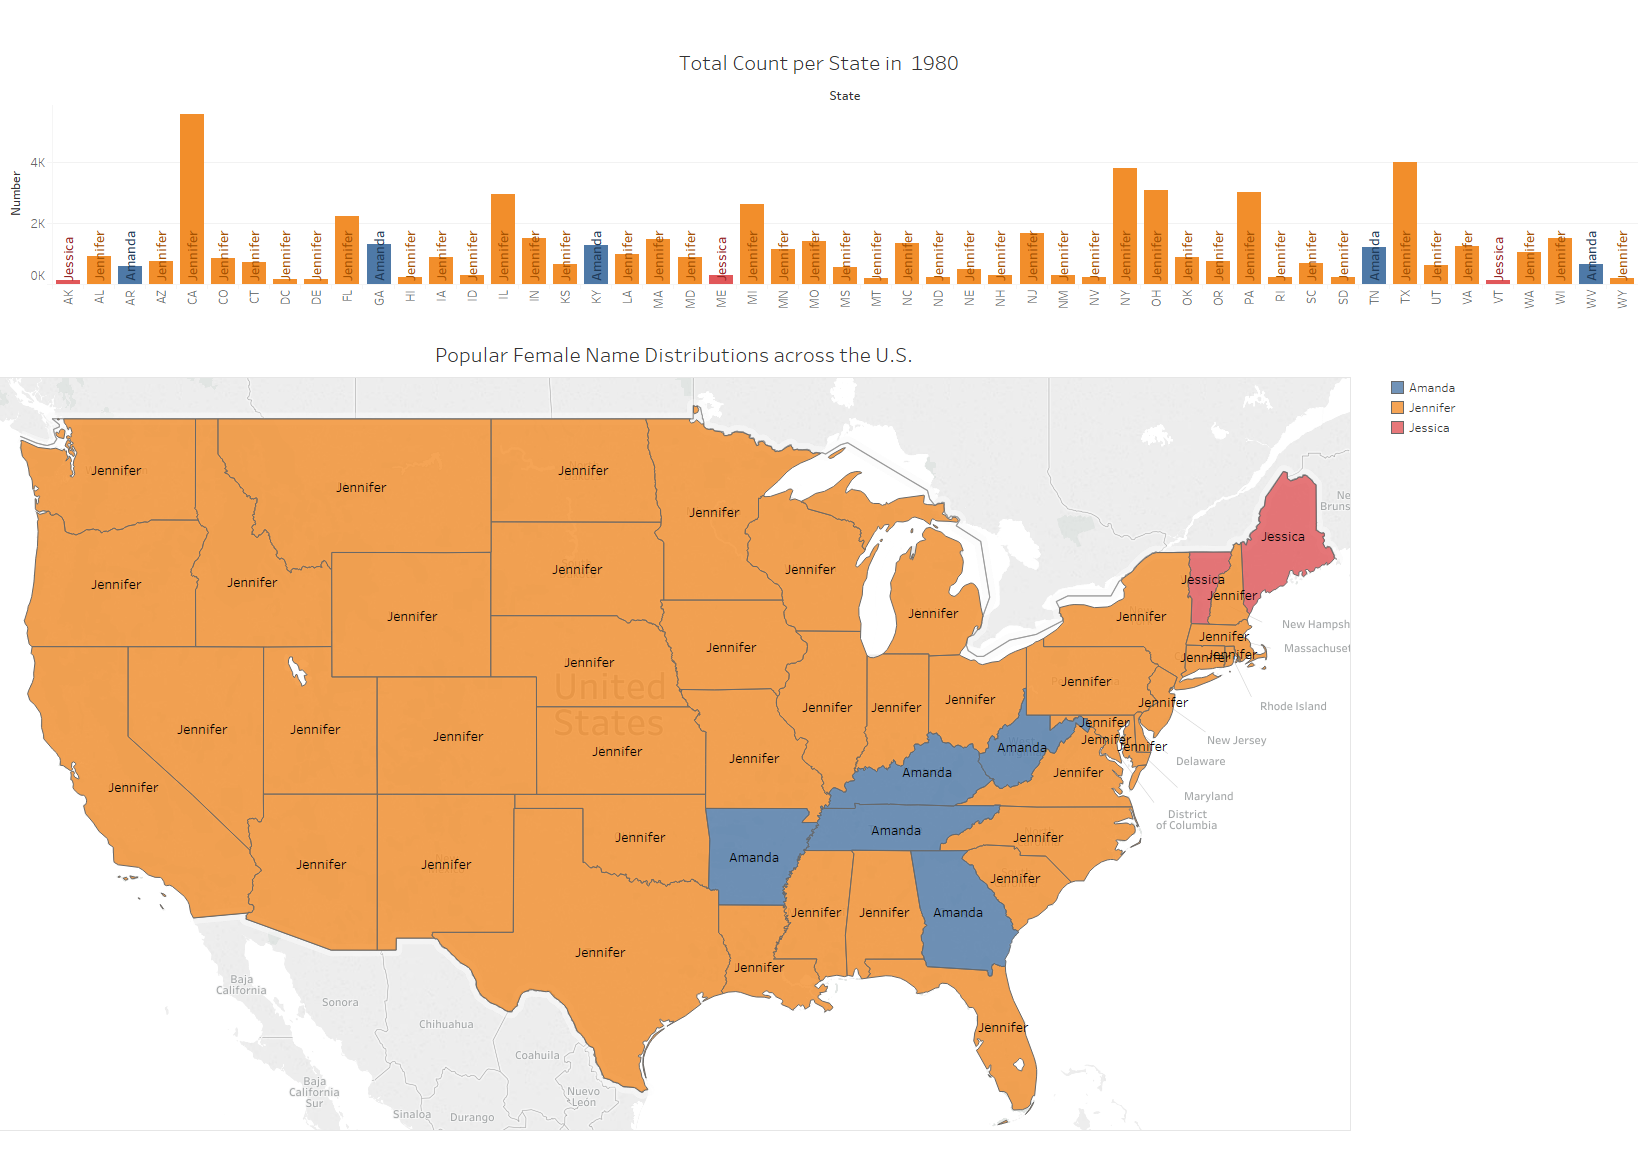
4) Comparing male and female names in 1914:
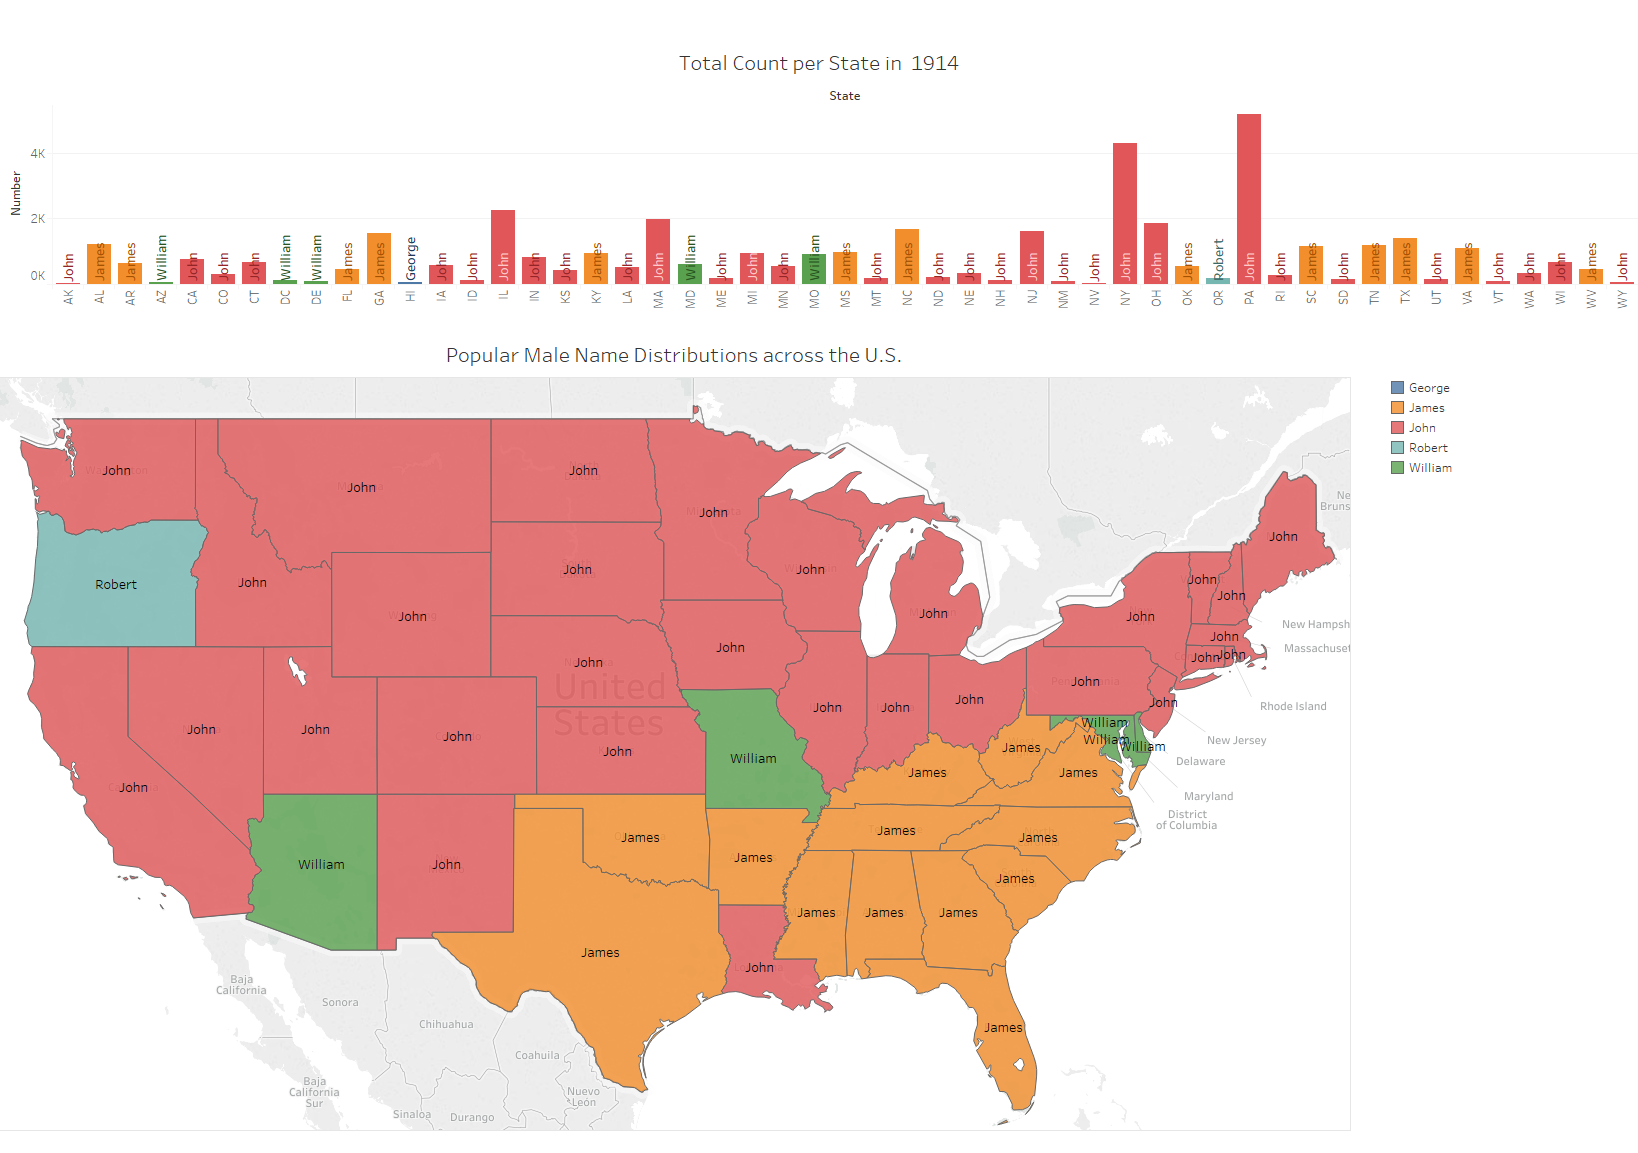
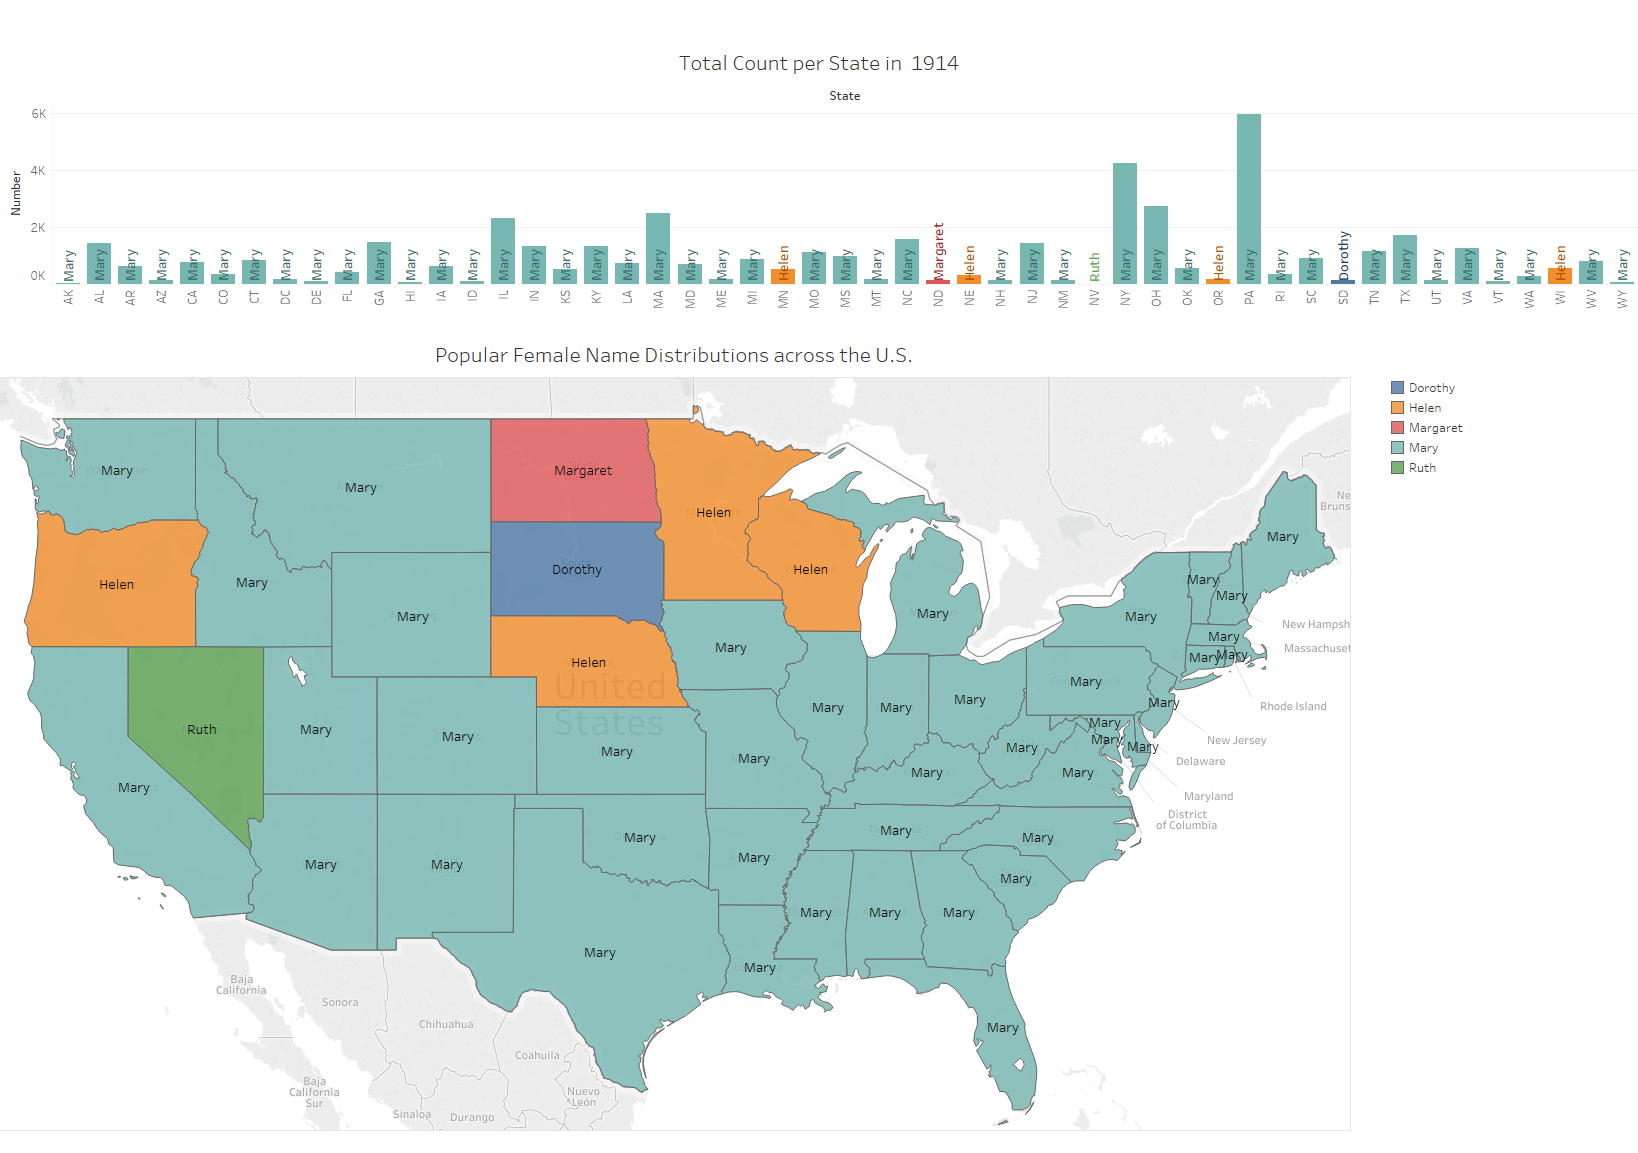
I made these visualizations to show the distributions of names across the states and to see how a name’s popularity or trend can change dramatically between a 10, 20, or 100 year period.